Debugging Tools:
There are different ways to troubleshoot a Blackberry application. The application can be debugged on the simulator while writing the application using Eclipse. In this example, I will debug an application that was written for previous tutorials.
To debug an application, click on the Debug menu item in the Debug menu or click F11. Choose Blackberry simulator if options come up and hit Ok.
The simulator may take a while before it starts working when the Debugger is attached. This will also open up the Console window as shown below.
On the top-right section, the Java button is selected. Clicking on the Debug button will show the Debug interface. The Debug interface is shown below.
Just below the Debug interface is the source code for the file. In this source code, we can set breakpoints as shown below.
Breakpoints allow the application to stop when it is run in the simulator at this particular point.
Below the source code, is the Console window that displays messages from JVM and also from the application. The Console window is helpful to debug application as we can display messages from the catch section of a try-catch block and print out the exception details if it is hit.
The Variables window appears next to the Debug window. When the application is run and hits the breakpoints, the variables are displayed in the Variables window as shown below.
The application can be resumed by clicking on the Resume (F8) option as shown below.
Blackberry Memory Statistics
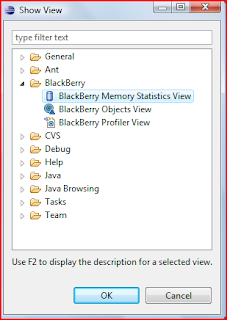
To set the memory statistics view, click on the Window > Show View > Other > Blackberry and choose Blackberry Memory Statistics View as shown below.
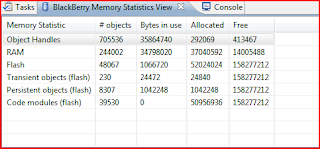
To use this, set a breakpoint and run the application. When the application pauses, click on the refresh button on the Blackberry Memory Statistics View. An example of the data is shown below.
Blackberry Objects View
This shows all the objects running from all the application. This can be viewed the same way as blackberry memory statistics by choosing the Blackberry Objects View. Typical data returned is shown below.
We can also the Garbage Collection function to check if the objects are properly deallocated.
Blackberry Profiler View
The Profiler displays information on where the application spends most of its time. It can be run same way as before by choosing the Blackberry Profiler View. Typical data returned is below.
Garbage Collection
Blackberry is Java based and it automatically frees up memory as necessary. Though garbage Collection can be called manually, Blackberry highly recommends against it.
Memory Leaks
Memory leaks can happen when the application maintains a reference to an object that is no longer needed. It can usually happen within the data structures, local variables, runtime stores and listeners. This can be very hard to detect but we can look for symptoms like the hourglass that appears as it performing garbage collection quite often.
Deadlocks
Deadlocks can happen when multiple threads are waiting for each other and hence the application gets blocked forever. The JVM can detect this issue and eventually end the application. On Blackberry, it is easy to identify a deadlock by having the “Interrupt debugger on potential deadlock” selected from the Run > Debug Configuration option as shown below.
While running the application, it will close the simulator and display the deadlock details in the Console window.
Setting up the simulator
We can modify simulator settings to work in different environments. For example, we may need to connect to a network using MDS or choose a specific model. We can change the settings by navigating to Run > Debug Configuration > Simulator as shown below.
Conclusion
Creating and debugging Blackberry applications in Eclipse IDE is quite easy as the application can be debugged and configured quite easily.
Subscribe to:
Post Comments (Atom)


No comments:
Post a Comment